Other Situational Awareness Platforms
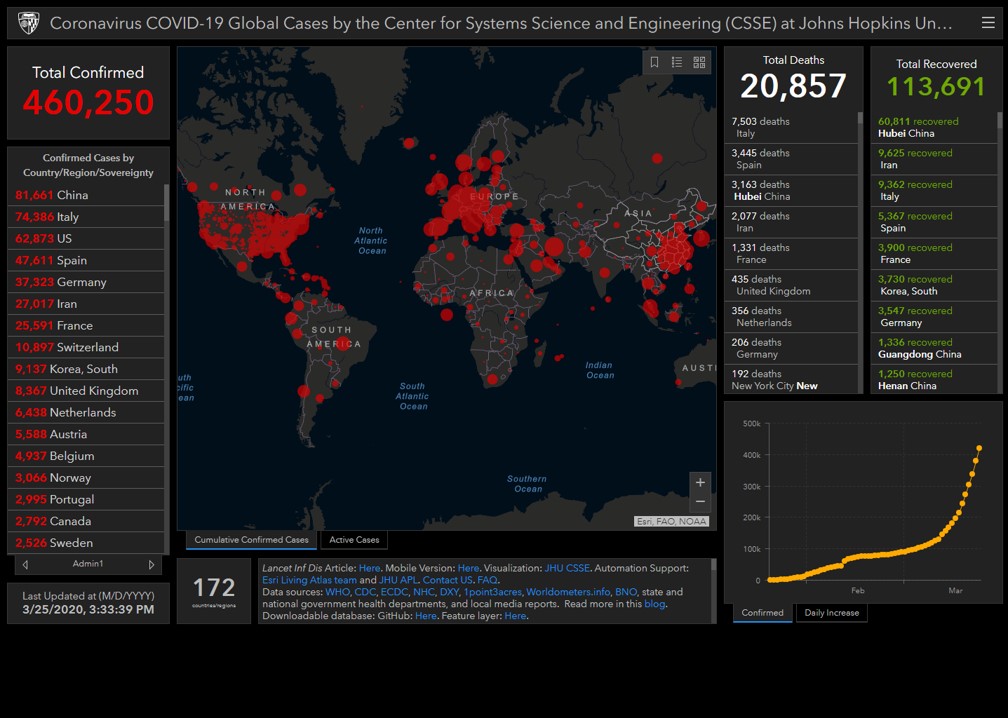
Corona Virus COVID-19 Global Cases by Center for Systems Science and Engineering (CSSE) at Johns Hopkins University. This is the worldwide tracking map commonly displayed on TV by major news organizations.
World Data
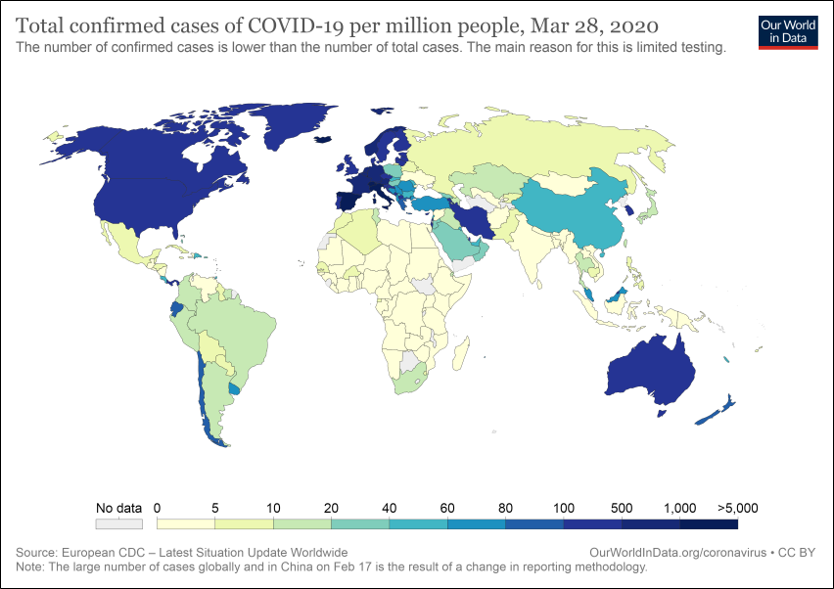
Coronavirus Disease (COVID-19) – Statistics and Research website which updates daily and is filled with maps and graphs which illustrate the progression of the COVID-19 outbreak. A product of Our World in Data based of Oxford University in England.
World Data
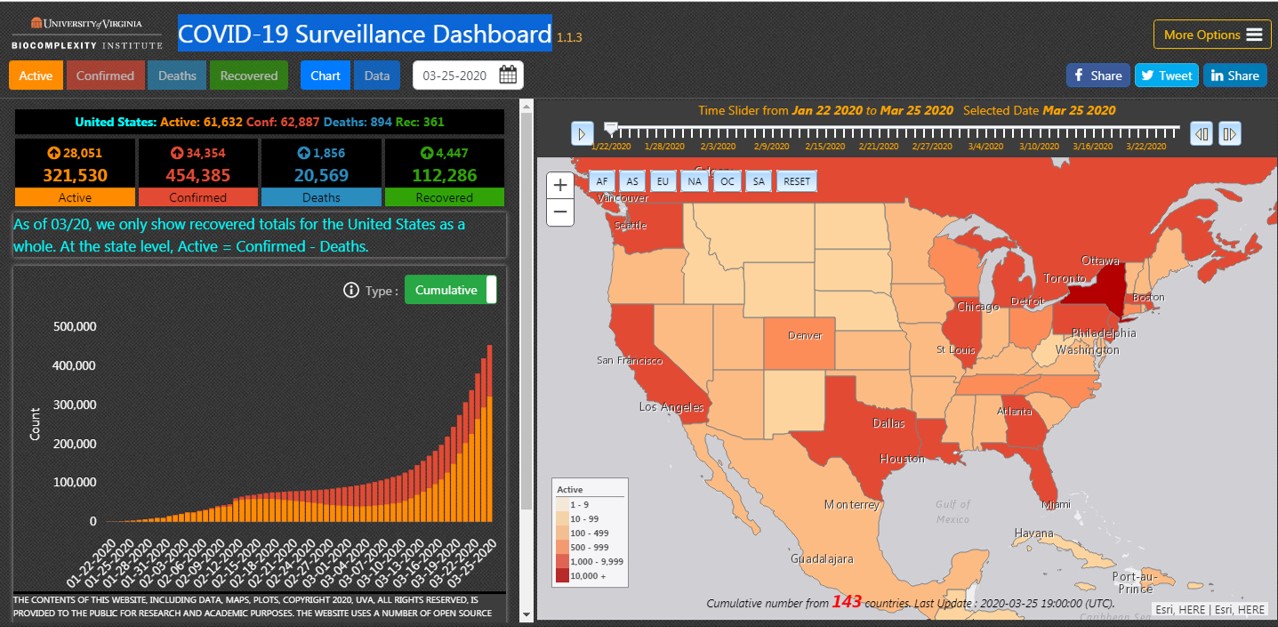
COVID-19 Surveillance Dashboard by the Network Systems Science and Advanced Computing (NSSAC) division of the Biocomplexity Institute and Initiative at the University of Virginia. Although similar to the John Hopkins map above, this platform is primarily focused on the United States and allows the user to point and click on each state to see reporting details.
World, U.S., State & Local Data
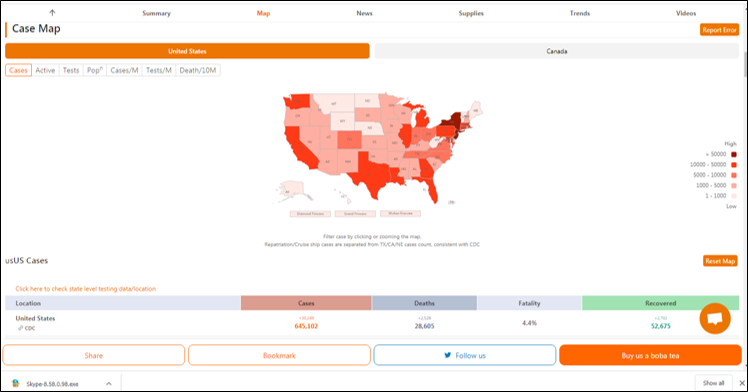
COVID in the United States and Canada by 1point3Acres.com has been cited as the U.S. source data by several well-known and influential data platforms. The site is loaded with graphs and other visuals tracking both the global outbreak and the one in North America.
World, U.S., & State Data
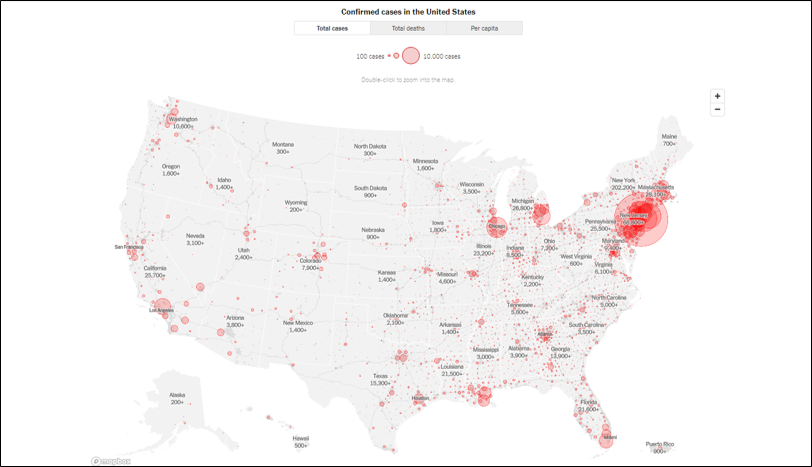
Coronavirus in the U.S.: Latest Map and Case Count is a product of The New York Times, which like several of the other services on this page, has made their data available on GitHub. Newspaper article type discussions intermix with excellent maps and graphs that have been assembled by a staff of more than 80.
U.S., State & Local Data
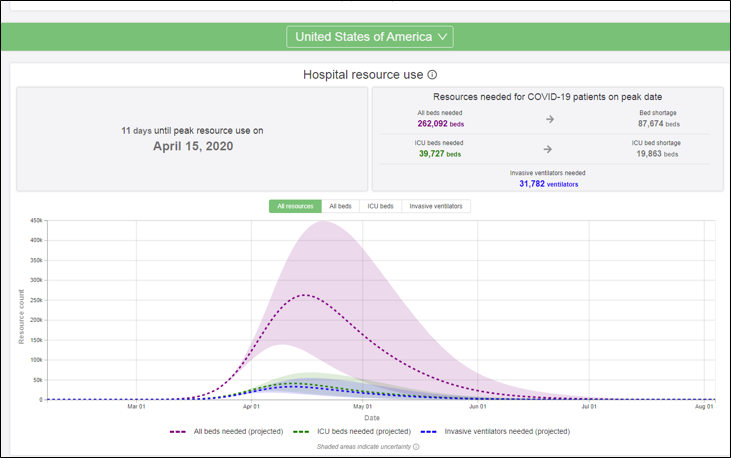
IHME COVID-19 Projections by the Institute for Health Metrics and Evaluation at the University of Washington is currently "the" definitive source for estimating COVID-19 medical equipment needs and projections of population outcomes. You will see stats from this institute used by the White House during their daily briefings.
U.S. & State Data
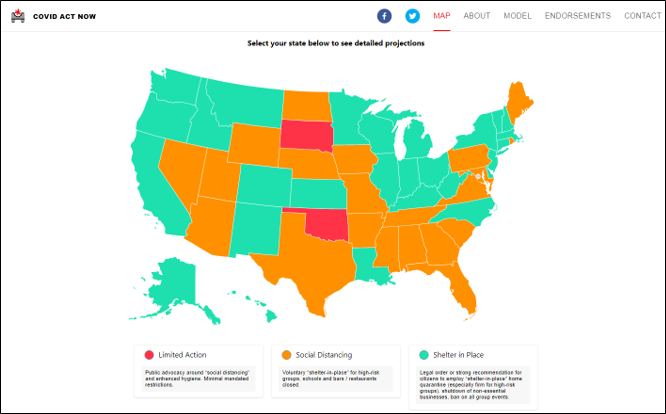
COVID Act Now appears to be a simple interface showing various state level COVID-19 restrictions, but is instead a very powerful interface created by a team of academics, statisticians and health professionals which shows potential "curve" scenarios versus available bed space. By clicking on a state, the respective graph will open. Offers an alternative to the IHME view above.
State Data
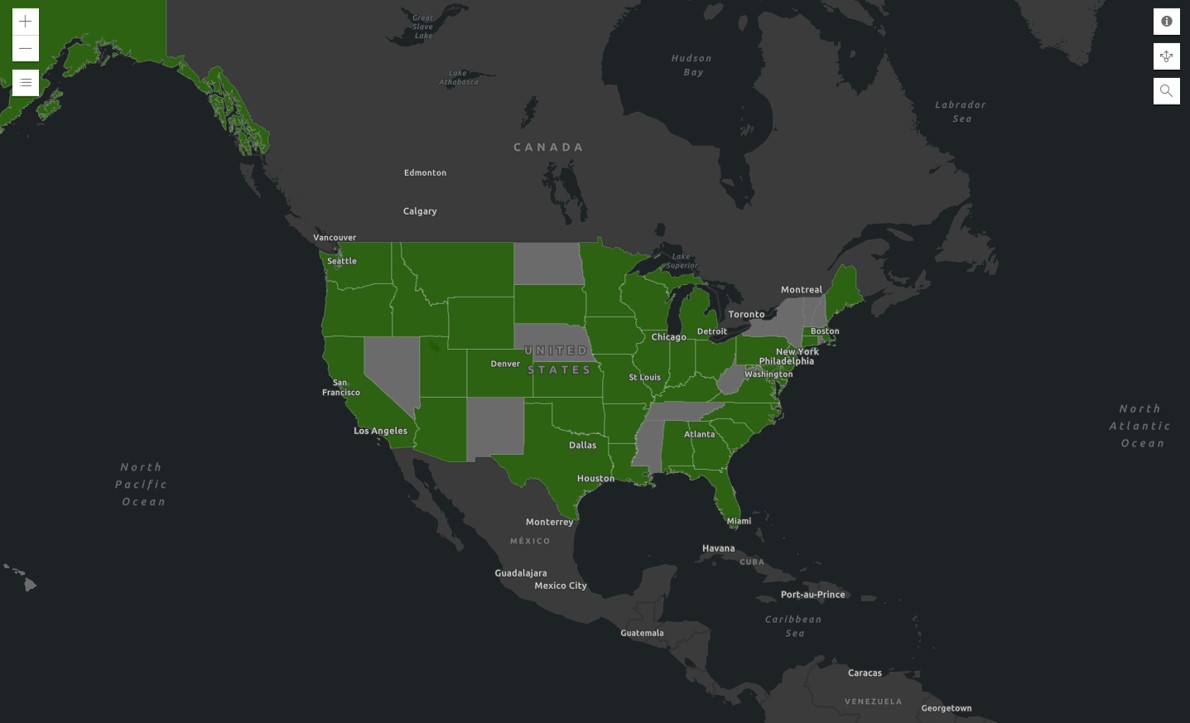
COVID-19 State Level GIS Resource Map is a product of the combined efforts of the National States Geographic Information Council (NSGIC) and the National Alliance for Public Safety GIS (NAPSG), this interface provides access to state specific dashboards by pointing and clicking on any state colored in green.
State Data
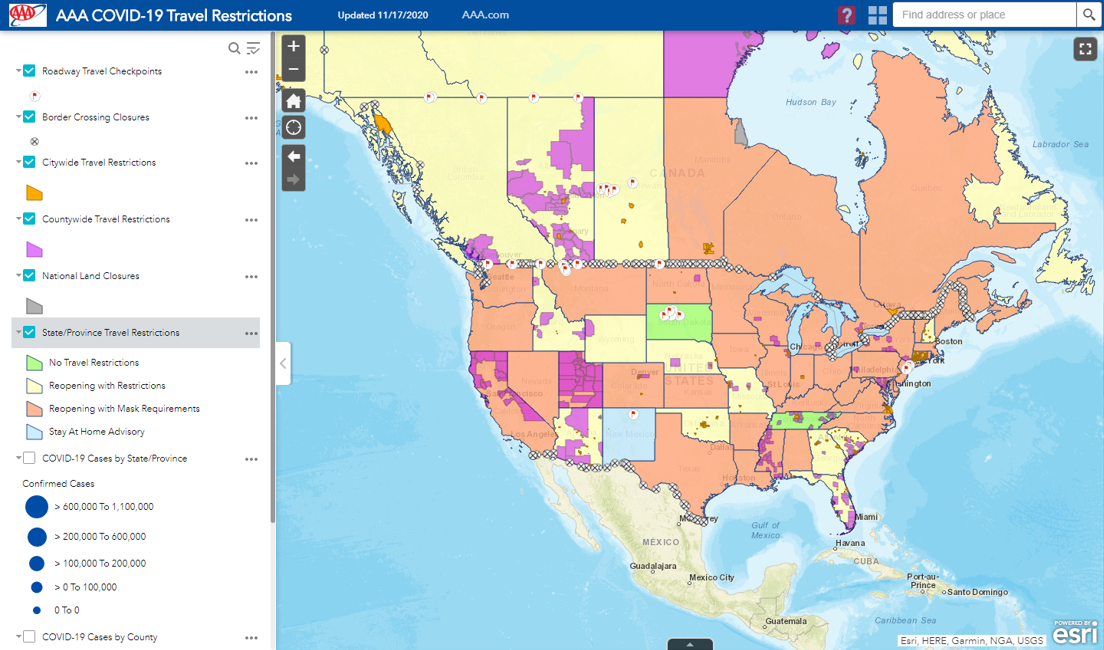
AAA COVID-19 Travel Restrictions Map is being offered by AAA to help travelers plan their trips and know what to expect when arriving for local area business and social restrictions. It is updated continuously as new restrictions are put in place or removed. Point and click on state/county polygons to see the type of restrictions and reference for those items.
State & Local Data
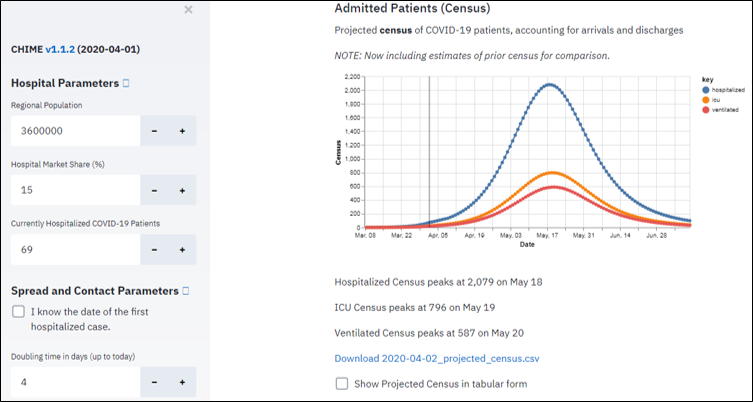
COVID-19 Hospital Impact Model for Epidemics (CHIME) is a product of the Predictive Healthcare team at Penn Medicine to assist hospitals and public health officials with hospital capacity planning. By entering local demographics for a hospital area of service, impact of the "curve" on that hospital's resources is displayed.
Local Data
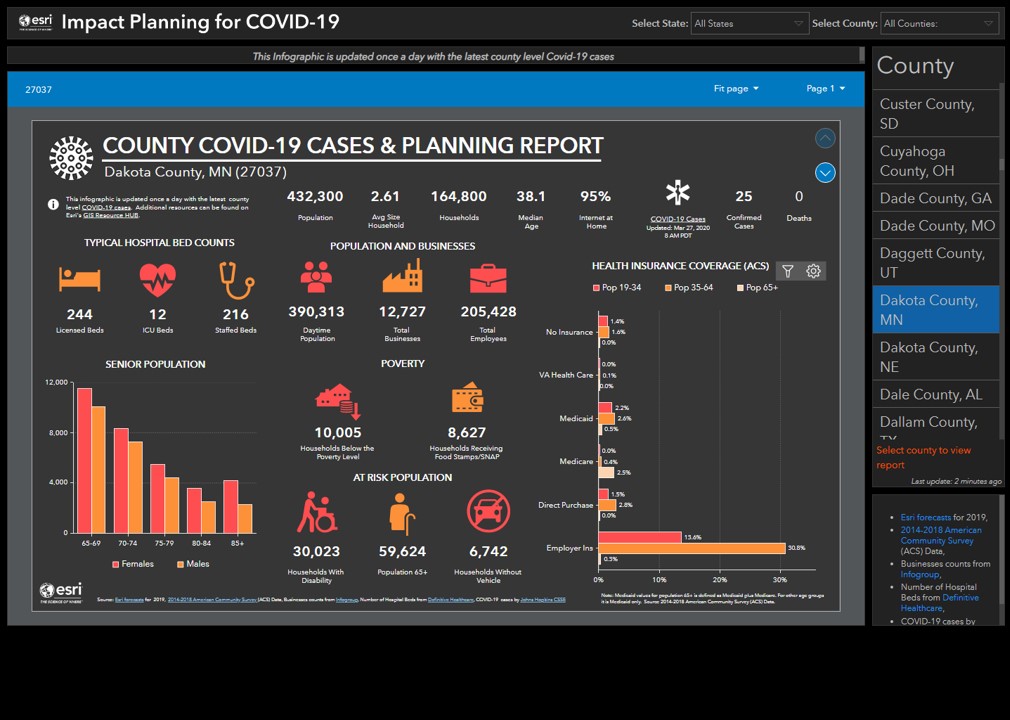
Impact Planning for COVID-19 by ESRI offers a wealth of demographic data by county, to include tracking of latest COVID-19 numbers. It uses a 2-page format to cover the relate the information in a graphic format.
Local Data
